Overall Finances
To get started, select Finances from the main menu.
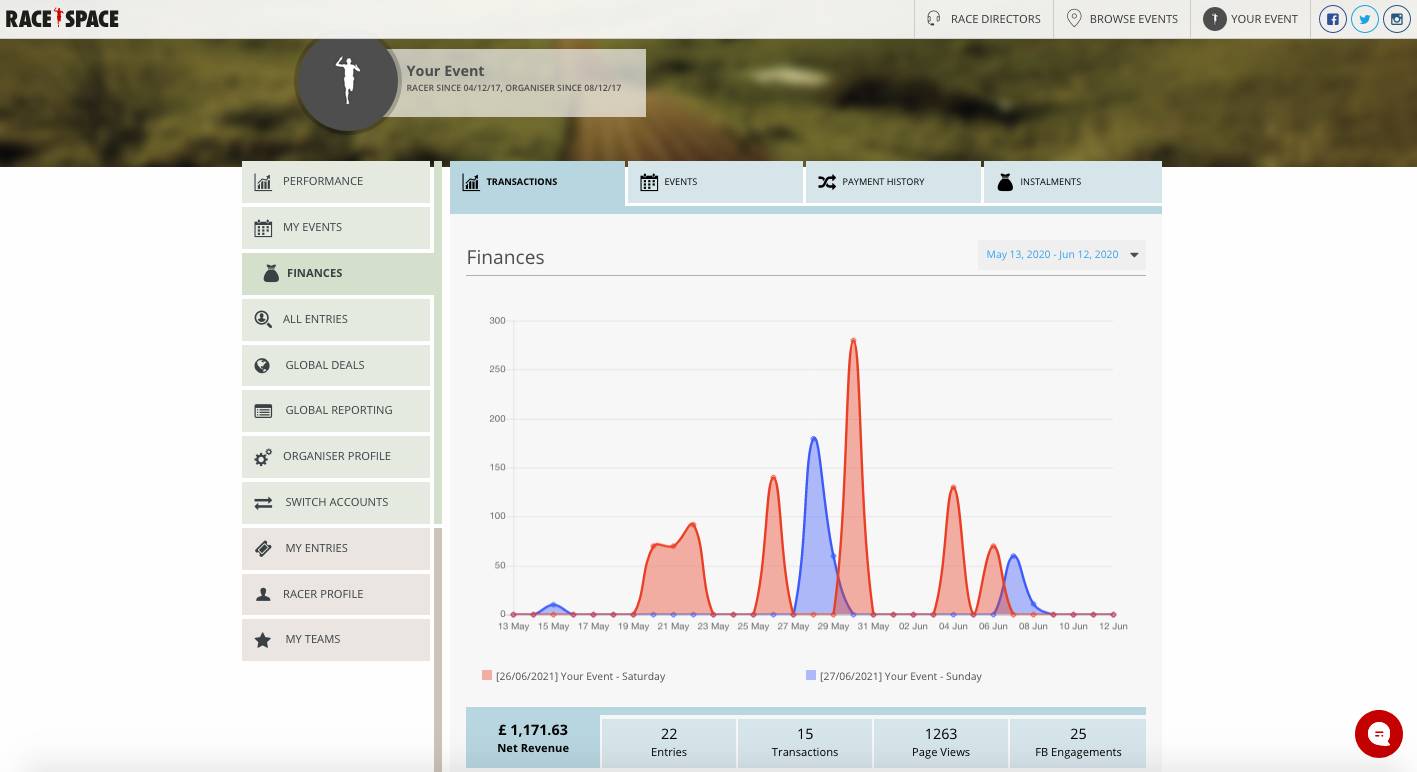
Above the graph are the main finance sections grouped into Transactions, Events, Payment History and Instalments. These sections and the graph just below it provide the most useful sales data for each of your live events over the last 30 days (this is the default setting with options to customise explained below).
Below is a description of what each of these main finance sections capture and data tools you can use within each:
- Transactions: Provides a list of every transaction coming into or out of your Race Space account, as well as supporting data for each transaction. The most recent transaction always appears at the top. Below are some useful tools for this section:
-
- Remove/add the events shown on the graph by clicking on the event in the key just below the graph.
- Change the date parameters for the graph by selecting your date preferences in the top right of the graph.
- Switch between using the blue tabs below the graph which are the five main metrics capturing data on Net Revenue, Entries, Transactions, Page Views and Facebook Engagements. The chosen metric will be populated in the graph based on the chosen date parameters.
- Export a list of transactions as an Excel document by selecting the Export transaction history link in red at the bottom of the list.
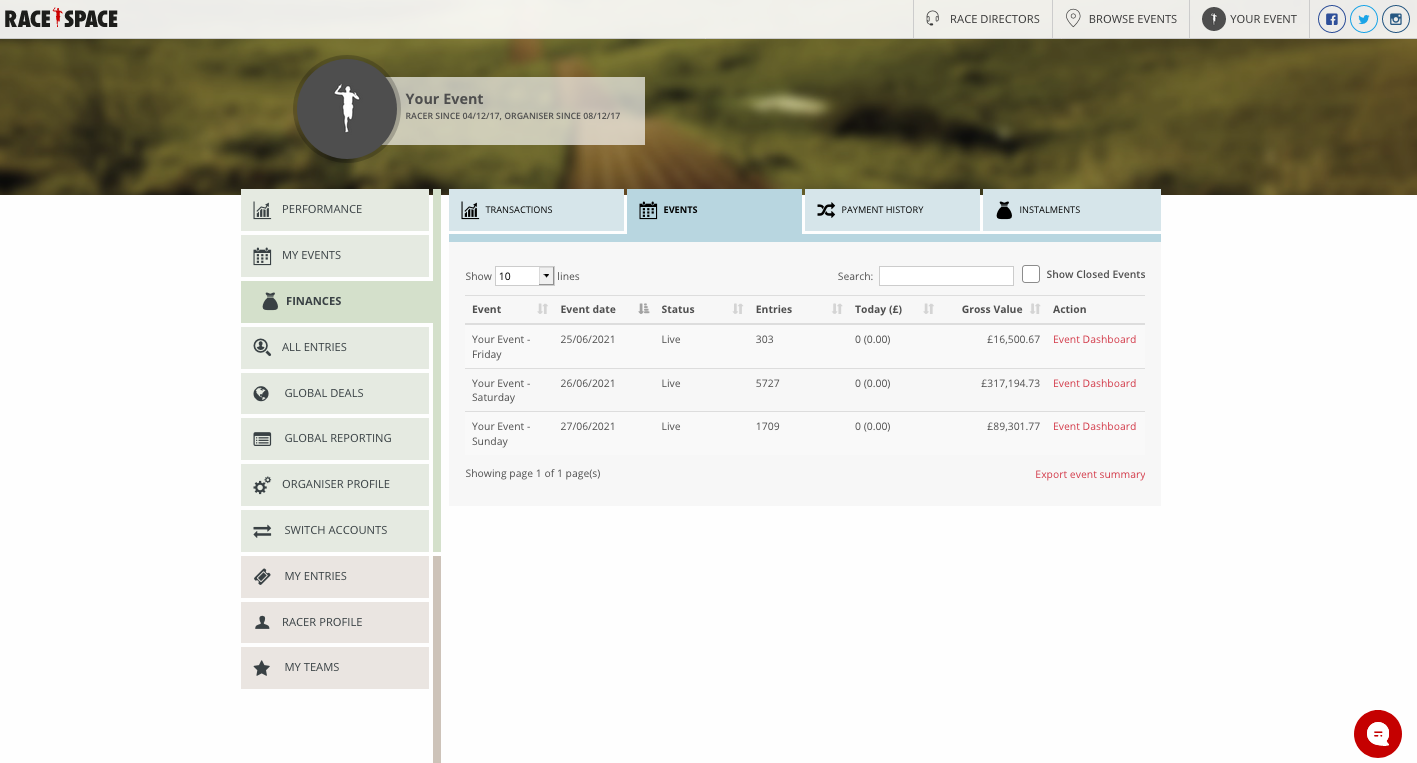
- Events: Provides a list of your events with top-line statistics covering event dates, event status (paused or live), daily revenue and gross value. In this section you can also access each of your event dashboards by selecting Event Dashboard in the Action column.
- Payment History: Allows you to see a detailed list of payments made to you by Race Space, including breakdowns.
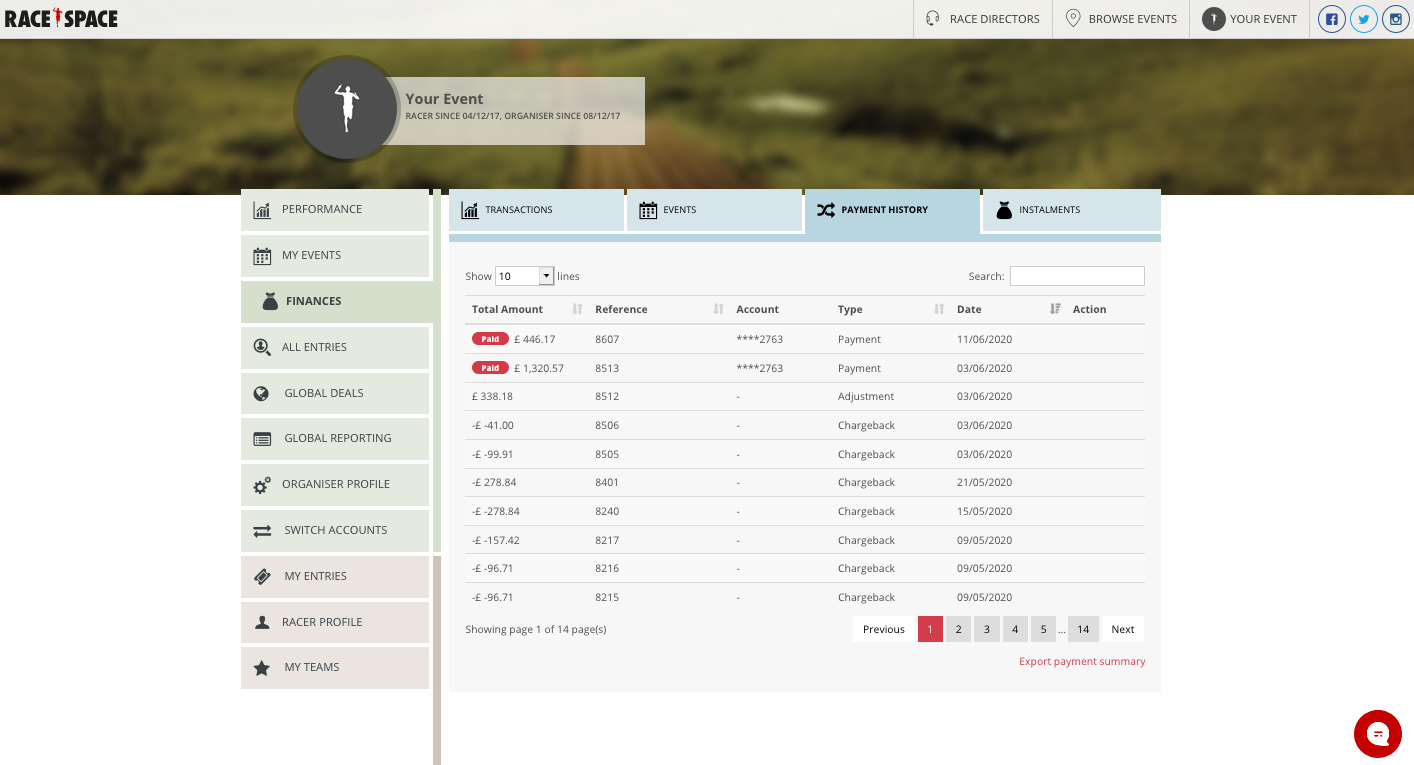
Check out the How It Works section for more information on Chargebacks and Adjustments.
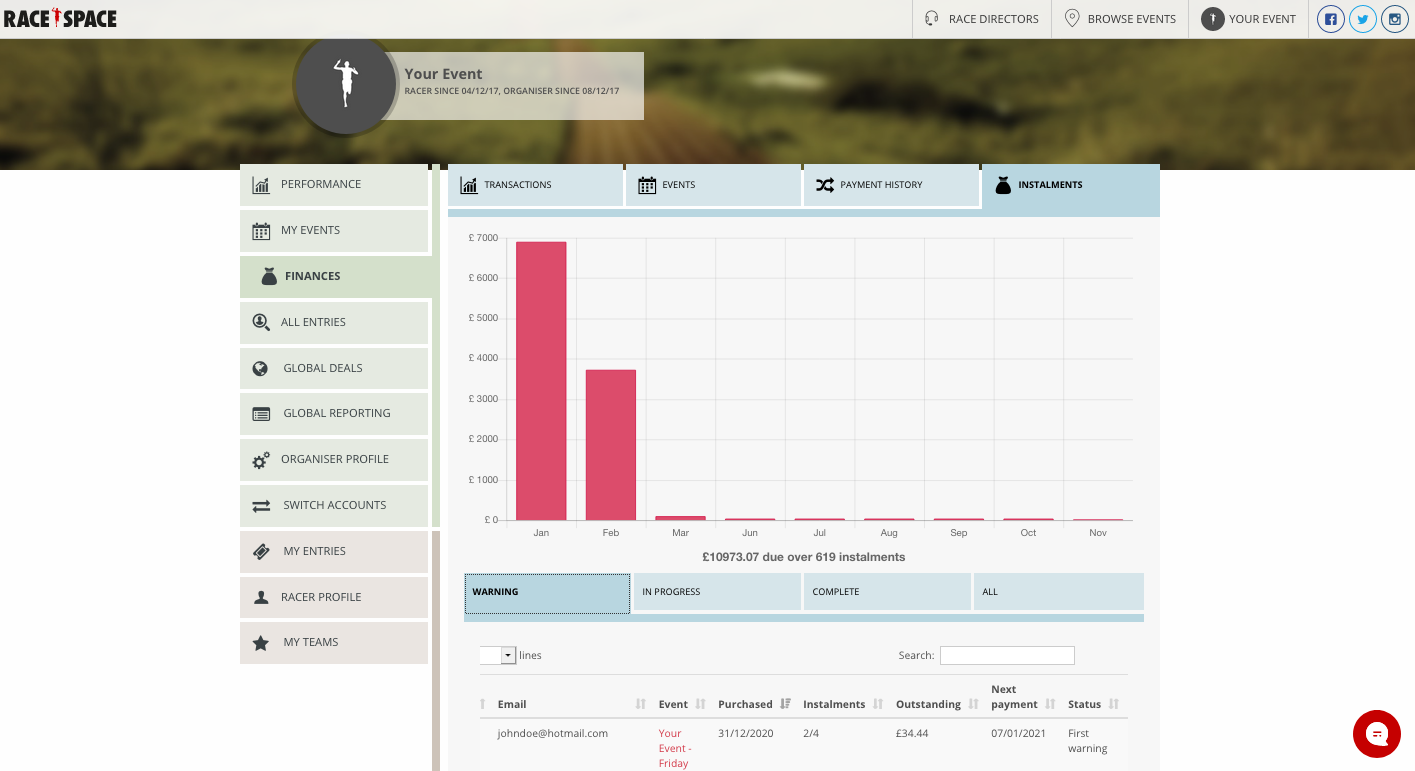
- Instalments: Provides a list of all participants using the instalment plan option for purchasing tickets to your events. Below are some useful data tools for this section:
- Switch between using the blue tabs below the graph which are metrics capturing data on instalment Warnings, In Progress, Complete and All.
- The graph in this section provides a month-by-month breakdown of the total instalment plan amount due across your events and the total number of instalment plans this equates to.
Click here for more information on Instalments.
Still stuck? How can we help?
{"modalTheme":"cara","mailCustomCSS":""}

